
The weakest link in any coding project is you. That is, human error is almost always a guarantee, which will rise up in the form of bugs and other issues. You won’t want any of these to make it to your live site, which is why WordPress debugging is a necessary step during your project.
In fact, WordPress includes a debug mode of its own, which can help when you work with the platform. If you combine this with your off-platform debugger, you’ll have a robust system to catch anything that lurks in the dark.
For this post, we’ll look at  WordPress debugging, and show you how to set it up. First though, we’ll look at how WordPress debugging and other types of bug catching differ. From there, we’ll explain why WordPress needs its own debug system before we show you how to use it.
The difference between WordPress debugging and general code debugging
Of course, WordPress uses PHP to run almost everything under the hood, much like many other web applications. However, WordPress debugging can be different from general code debugging due to its specific structure and ecosystem.
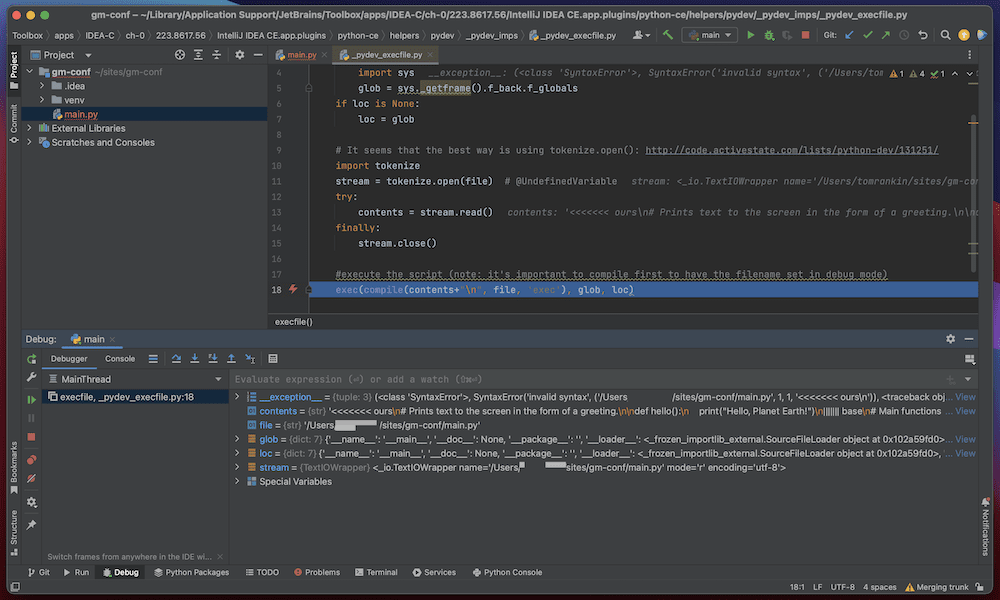
The primary difference between WordPress debugging and general code debugging is how you’ll view the errors. WordPress will display error messages relating to the platform on the frontend. In contrast, general code debugging often happens within the Terminal or your dedicated code editor:
Another difference is the use of WordPress-specific functions to help with the debugging process. WordPress provides its own set of functions that you’ll use to interact with the Content Management System (CMS). These differ from typical PHP functions, and will require you to take a specific approach to use them for debugging.
On the whole, the difference between WordPress debugging and general code debugging lies in the specific structure and ecosystem of WordPress. As such, you’ll need to understand WordPress’ architecture, along with what the platform offers to debug issues effectively.
Why WordPress debugging requires a specific process
WordPress doesn’t only use its core PHP. It also runs external PHP in the form of themes and plugins. If you combine third-party development with how all of these hook together, it could introduce bugs when you mesh all the code together. As such, WordPress offers its own debugging tools to help root out these issues during development.
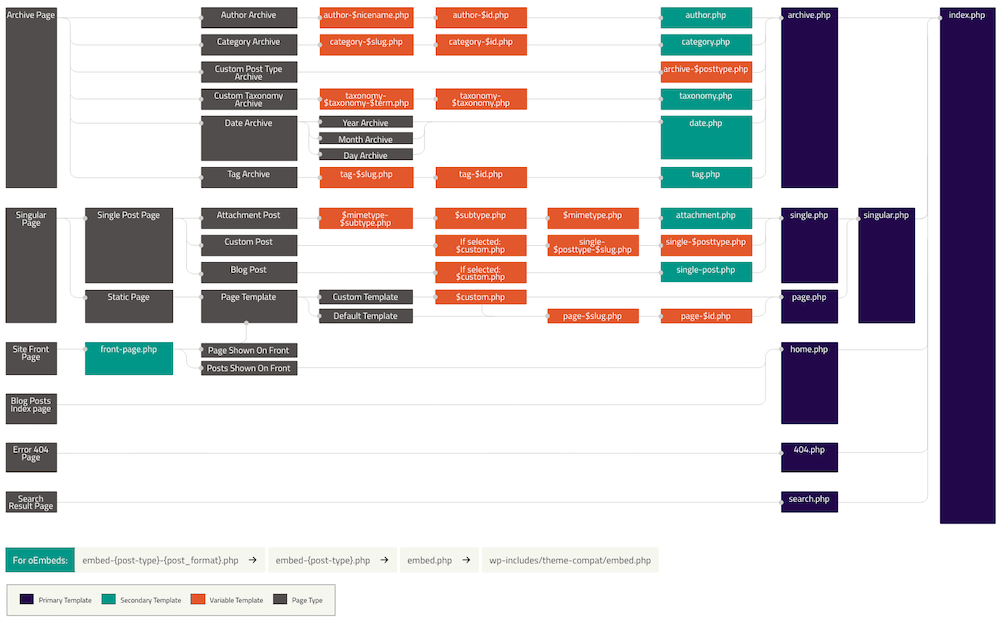
Another area you’ll need to understand (and which affects why you need dedicated WordPress debugging) is its core file and folder structure. Creating a theme, for instance, relies on a template hierarchy that could matter when you are carrying out a line scan to find the source of an error.
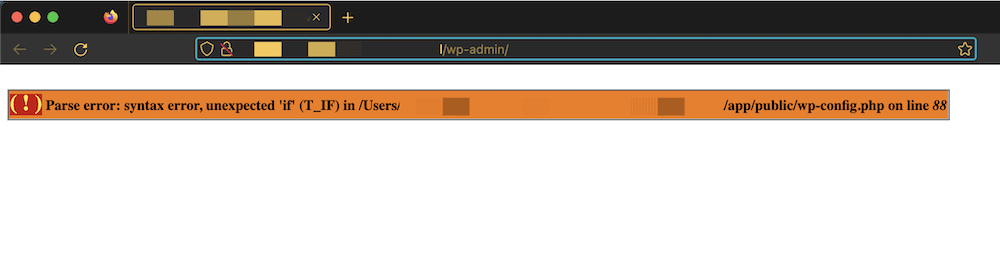
Also, WordPress’ design is based on a good User Experience (UX). The dedicated WordPress debugging process takes into account the need for user-friendly error reporting. Instead of using complicated stack traces within your code editor, WordPress instead displays a clear error message on the frontend:
Speaking of UX, WordPress offers a set of custom functions to help make your workflow more efficient and secure. As a result, the WordPress’ specific debugging process means you’ll need to understand these functions and how they interact with the platform.
Overall, WordPress has a complex ecosystem, a focus on UX, and custom functions. All of this requires its own debug mode. In the next section, we’ll look at how to toggle this on.
How to turn on WordPress’ debug mode (and what this does)
You can turn on WordPress’ debug mode through the wp-config.php file. We have a quick guide on how to do this, and it shouldn’t take you more than a minute or so. However, there are a few different modes you’ll want to know of, and potentially use:
WP_DEBUG. This is the basic debug mode in WordPress. It enables general debugging within the platform.WP_DEBUG_LOG. This mode saves all PHP errors, warnings, and notices to adebug.logfile in the wp-content directory. It is useful for identifying hard-to-find issues that do not appear on the frontend.WP_DEBUG_DISPLAY. This mode displays all PHP errors, warnings, and notices on the frontend. It’s useful for identifying issues with themes and plugins, but it might also display messages for elements that don’t seem broken. For instance, you’ll often see notices for incorrect data validation conventions.
These three functions can intertwine, so you’ll need to take care in order to use them in an optimal and safe way. For instance, you’ll often want to turn on WP_DEBUG and WP_DEBUG_LOG to store any errors to the debug.log file. However, if you don’t turn off WP_DEBUG_DISPLAY, displaying those errors on the frontend would be bad for UX.
You can also go beyond the bread and butter commands and activate some other constants we cover in another article:
SCRIPT_DEBUG. For performance reasons, WordPress uses minified CSS and JavaScript files, but these could be a nightmare to debug. Once you turnSCRIPT_DEBUGon, WordPress will use the unoptimized development versions of the files instead.SAVEQUERIES. This saves all database queries in an array, which can help you identify slow or inefficient queries that affect your site’s performance.
WordPress wouldn’t be the platform it is without its plugins. As such, there are plenty of helpful plugins to assist with WordPress debugging. Next, we’ll look at some.
Using WordPress debugging plugins during development
Plugins should be part of your arsenal to help investigate errors. In fact, WordPress’ official documentation on debugging includes some recommended options.
For instance, Query Monitor will give you detailed information about the queries you execute. This is a fantastic way to help identify queries that cause performance issues.
Debug Bar adds a debug menu to the WordPress admin bar. This lets you access debugging information at all times, and includes detailed information about PHP errors, database queries, as well as HTTP requests.
Because WordPress uses a lot of custom functions and constants, you’ll likely want to keep tabs on whether they deprecate. The Log Deprecated Notices plugin identifies (and logs) any use of deprecated functions, hooks, or arguments in WordPress. You’ll use the plugin to help keep your code up-to-date with the latest WordPress standards.
However, there are many more plugins you can install to help with WordPress debugging. One fantastic option is Simply Show Hooks:
This plugin lets you view every hook a page executes. It will often be a go-to plugin, because you can see at a glance what WordPress hooks a page uses, which will cut down on your initial hunt for a bug.
If you’d like to find a plugin that is more of an all-in-one solution, DebugPresscould be a good choice:
This plugin gives you real-time debugging information, which includes PHP errors, database queries, and HTTP requests. It also includes a real-time console for monitoring server-side errors.
You might want to semi-automate the initial instantiation of WordPress’ debug mode. This is what the excellent WP Debugging plugin is for.
It lets you set default states for all of the available debug constants without the need to open the wp-config.php file. You’ll toggle them through a quick activate and deactivate within WordPress’ Plugins menu.
Choosing WordPress debugging plugins
When it comes to choosing WordPress debugging plugins, plugin quality metrics such as the Last Updated time are less of a concern. This is because they often perform tasks that don’t require a constant current codebase.
For instance, Log Deprecated Notices has its last update back in 2021. However, despite this, it’s still a recommended plugin for WordPress developers. As such, we’d argue that if the plugin works as intended and doesn’t introduce further issues, you’ll be good to use it for debugging purposes.
The benefits of Application Performance Monitoring (APM)
APM tools let you monitor the performance of applications, which includes that of WordPress websites. The detailed performance information includes response times, error rates, and more.
It may not seem as though APM tools and debugging have much in common. However, this can help you mitigate some debugging work, depending on the scenario. What’s more, you can debug first, then maintain that performance using APM.
When it comes to WordPress debugging, APM tools have a number of benefits:
- You can identify performance bottlenecks on your WordPress website. The real-time analysis means you can identify any issues that may be slowing down your website.
- APM tools can help optimize your site’s performance. This lets you make targeted improvements and upgrade performance overall.
- By monitoring key performance metrics, you can identify any issues that may be impacting the health of your website.
- APM tools can also help identify security issues on your WordPress website. By monitoring traffic and site activity, you’re able to spot any unusual or suspicious behavior that may be indicative of a security issue.
There are a few APM tools available that suit WordPress well. For instance, Kinsta has its own APM tool, while WP Engine integrates New Relic’s APM into its services.
In general, APM tools can help improve the UX of your WordPress website, and have an impact on your debugging work. While it’s not a substitute, APM can help you ascertain whether the bug fixes are optimal, and where you can improve your code.
Tips to help you with WordPress debugging
Our focus for this post is on WordPress debugging. With this in mind, we’ll offer up six tips to help you have a better debugging session.
- Start with a static code analysis
- Lean on your debugging tools
- Classify each bug you come across
- Backtrack and carry out binary searches to seek out every possible bug
- Run a debugger after each new code suite
- Look to solve problems rather than squash bugs
1. Start with a static code analysis
A static code analysis is where you analyze code without running it. Your goal is to identify potential errors and vulnerabilities. You could do this through a line-by-line scan, although a tool will be more efficient. PHP CodeSniffer or the PHP Mess Detector both perform well here, with the former being a part of JetBrains’ editing tools too.
These tools can help identify coding standards violations, unused code, and other potential issues that may affect the performance and security of your WordPress website. You’ll generally install them on your development environment and run them against your codebase. The generated report will outline any potential issues. This gives you a way to identify and fix them.
Starting with a static code analysis lets you nip potential issues in the bud early on in the development process. This can help ensure your WordPress website is functioning well, before any issues become more difficult and time-consuming to fix.
2. Lean on your debugging tools
Speaking of debugging tools, they are near essential regardless of your language or CMS platform. This is especially true for WordPress, as there are a range of superb plugins to help you. However, third-party, off-platform tools will also provide value.
In most cases, debugging tools will give you a deeper understanding of your site. This will let you make more informed decisions when it comes to optimizing performance, improving UX, and enhancing security.
3. Classify each bug you come across
One routine admin task with debugging is to classify each bug you come across. This can be helpful in terms of identifying the root cause of an issue and determining the best fix.
You’ll want to consider multiple factors here, such as the severity of the issue, the impact on UX, and the complexity of the fix. For instance, you could use a system of severity levels, such as critical, major, minor, or cosmetic. This can help prioritize which bugs to address first, based on their impact on website functionality and UX.
Another way to classify bugs is to use categories such as usability, functionality, or security. This can help identify how the bug impacts specific areas of your website. In turn, this makes it easier to determine the root cause of the issue and the best approach to fixing it.
What’s more, you don’t need a special system to store these – a spreadsheet works just fine. You might even have a system within your code editor or Integrated Development Environment (IDE) such as color coding.
4. Backtrack and carry out binary searches to seek out every possible bug
“Backtracking” is where you retrace your steps to identify where a bug appeared first. You might look at recent code changes, test previous code bases, or review your logs. This is a good way to streamline the debugging process to ensure you address all potential issues.
By the same token, binary searches can be a useful technique for WordPress debugging, especially when dealing with complex issues. This involves testing different portions of the codebase in a systematic way to identify the location of the bug. You might isolate specific sections of the code, run tests, then move to the next section to further narrow down the issue.
This is an efficient way to identify bugs and figure out to fix them. You’ll likely save time and effort compared to more haphazard debugging approaches. Even better, this might be a better approach for larger codebases or more complex issues.
However, a binary search does require a methodical and organized approach in order to test and evaluate all potential issues. As such, documentation is important, as it lets you easily reproduce and fix any issues you identify.
5. Run a debugger after each new code suite
Much like saving your changes at regular intervals, you should also get into the habit of running a debugger after every complete code suite. Of course, you’ll want to make sure code functions as you intend before moving on.
One of the big benefits here is how you won’t have lingering bugs hanging around. This can help prevent issues from snowballing and becoming more difficult to fix as development progresses.
However, this approach can eat time, especially for large codebases or non-critical issues. Because of this, you might limit running a debugger to only critical code changes, or for more problematic areas of your codebase.
6. Look to solve problems rather than squash bugs
When it comes to WordPress debugging, it can be helpful to shift your focus from simply “squashing bugs” to solving problems. This means taking a more proactive approach to identifying and addressing issues, rather than simply reacting to errors as they occur.
To start, look for the root cause of the issue, then work to address that cause, rather than simply fixing the immediate symptoms of the problem. This may involve reworking certain sections of the codebase or adopting new development practices to prevent similar issues from occurring in the future.
This approach can improve the overall quality and reliability of your projects, reduce the likelihood of future issues, and enhance the UX. In addition, this approach can help you identify areas of improvement in your development process, which will lead to more efficient and effective development practices.
Conclusion 
In short, WordPress debugging will use the platform to report code errors that affect its operation. In addition, you’ll use some dedicated plugins in most cases to alert you to issues. In fact, the options you get to debug WordPress can work side by side with your typical debug tools such as Xdebug.
The good news is that you don’t have a clumsy integration process when it comes to WordPress. You can work with the wp-config.php file and switch the debugger (and log) on using boolean values. This will show any associated error along with more detail than you’d often get. From there, you can work to fix bugs and bring your site closer to finished.
Do you have any questions about WordPress debugging, or any scenarios you’ve come across? Let us know in the comments section below!