Wouldn’t it be great if there was a tool to help you make your website faster? Well, there is! Google PageSpeed Insights is the name, and it’s a free service that’s on hand to solve your slow website woes. In this article we’ll look at what it is, how it works, and how you can reach the elusive Google PageSpeed Insights 100 / 100 score in WordPress.
In this article we’ll look at what it is, how it works, and how you can reach the elusive Google PageSpeed Insights 100 / 100 score in WordPress.
What is Google PageSpeed Insights?
Google PageSpeed Insights is an online tool for measuring the speed and user experience of your website. It measures the load time of a site on desktop and mobile and displays various metrics about a site’s performance. If the metrics are judged to be suboptimal, the tool gives suggestions on how to improve them.
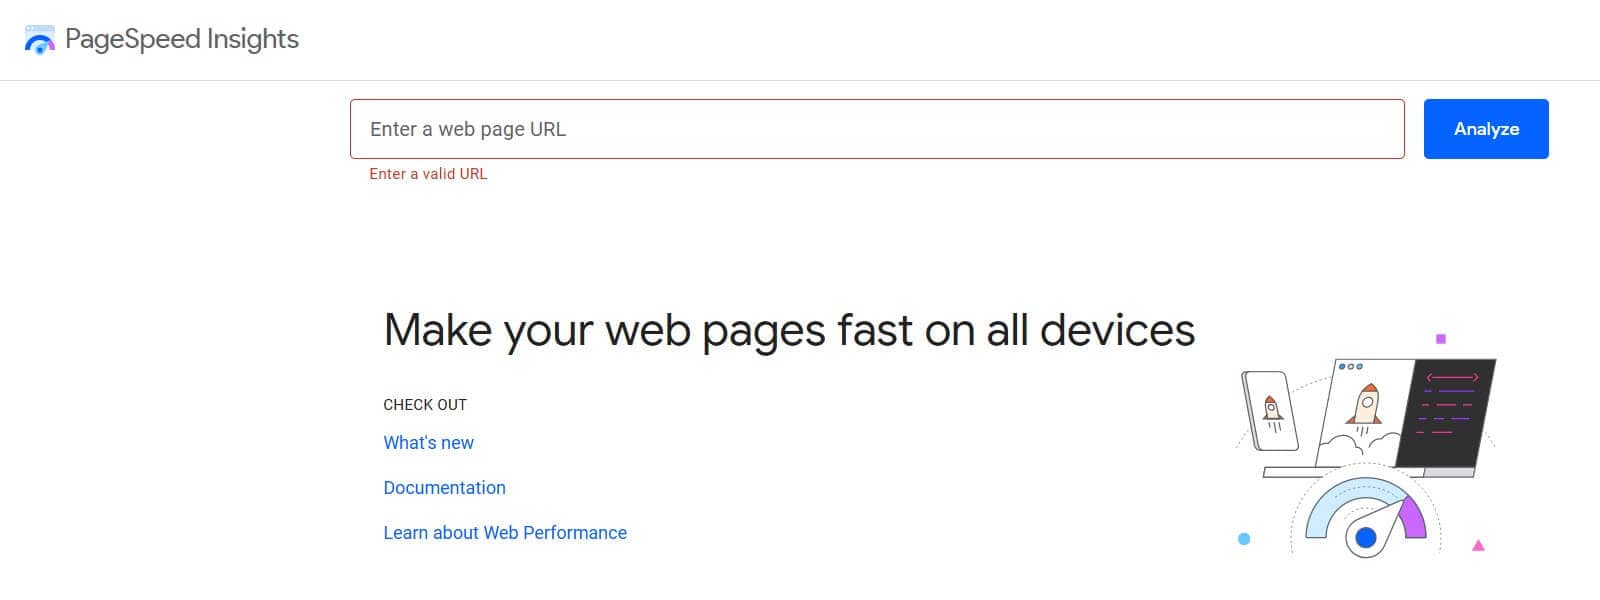
Simply go to Google PageSpeed Insights, enter a URL, and hit Analyze. Google judges your site on both mobile and desktop. You may find that you score better on one than the other.
Google used to give an overall score out of 100 for a web page, but they don’t any more.
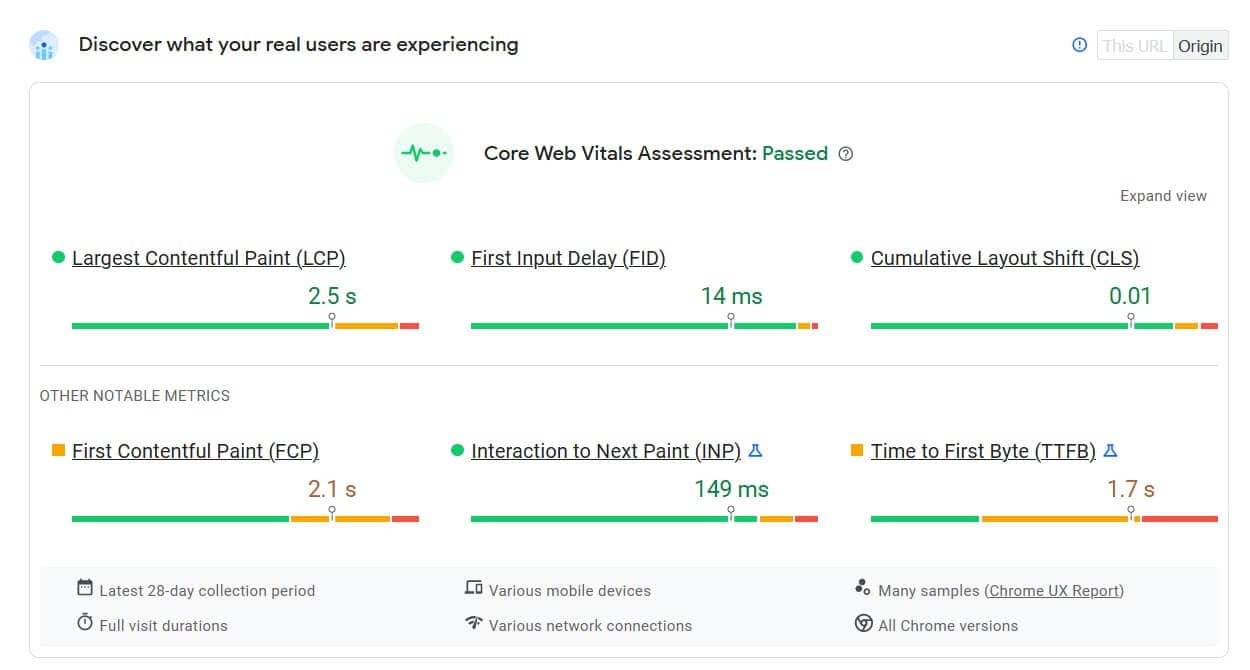
Instead, Google measures three statistics that it calls Core Web Vitals. These are:
- Largest Contentful Paint (LCP): how fast the main content of the site loads. This should be 2.5 seconds or less for a good user experience.
- First Input Delay (FID): how responsive the site is to user input. FID should be 100 milliseconds or less.
- Cumulative Layout Shift (CLS): measures the visual stability of a web page. A CLS score of 0.1 or less is preferable.
In addition, Google measures the following:
- First Contentful Paint (FCP): the time it takes for the web page to start rendering on the screen. A good FCP score is 1.8 seconds or less.
- Interaction to Next Paint (INP): measures how responsive the page is to user interactions. A really responsive website has an INP of 200 milliseconds or less.
- Time to First Byte (TTFB): the time taken for the first byte of data to be sent after a server request. A TTFB of 0.8 seconds or less is ideal.
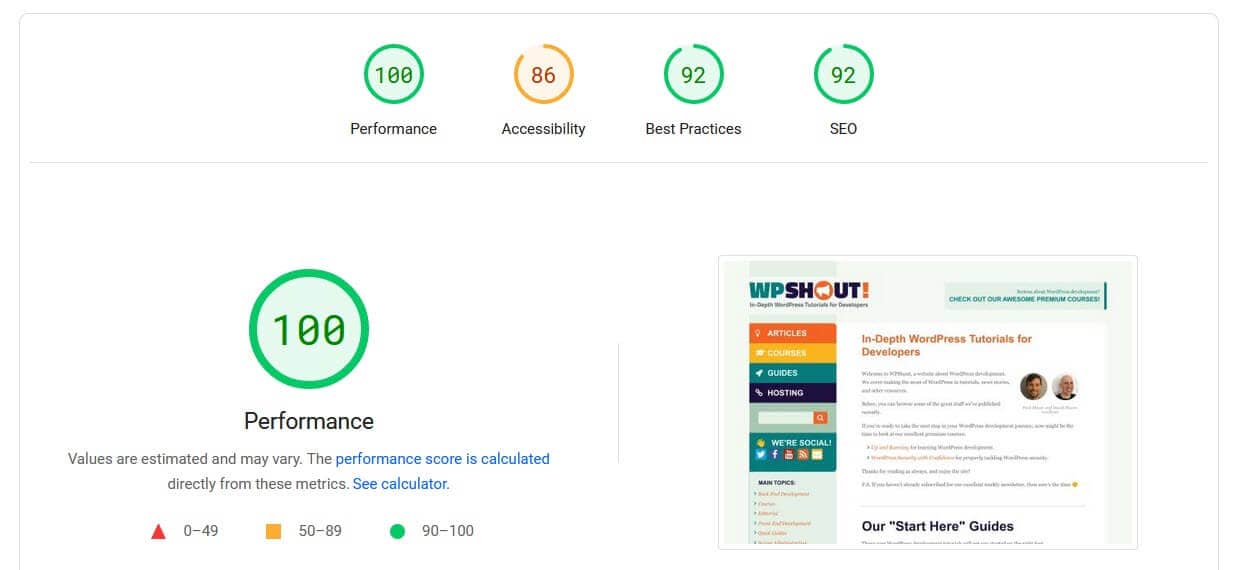
Below that, in the Diagnose performance issues section, Google PageSpeed Insights gives you four scores – Performance, Accessibility, Best Practices, and SEO. 90 or more is a good score, 50 to 89 indicates improvement can be made, and anything under 50 is bad.
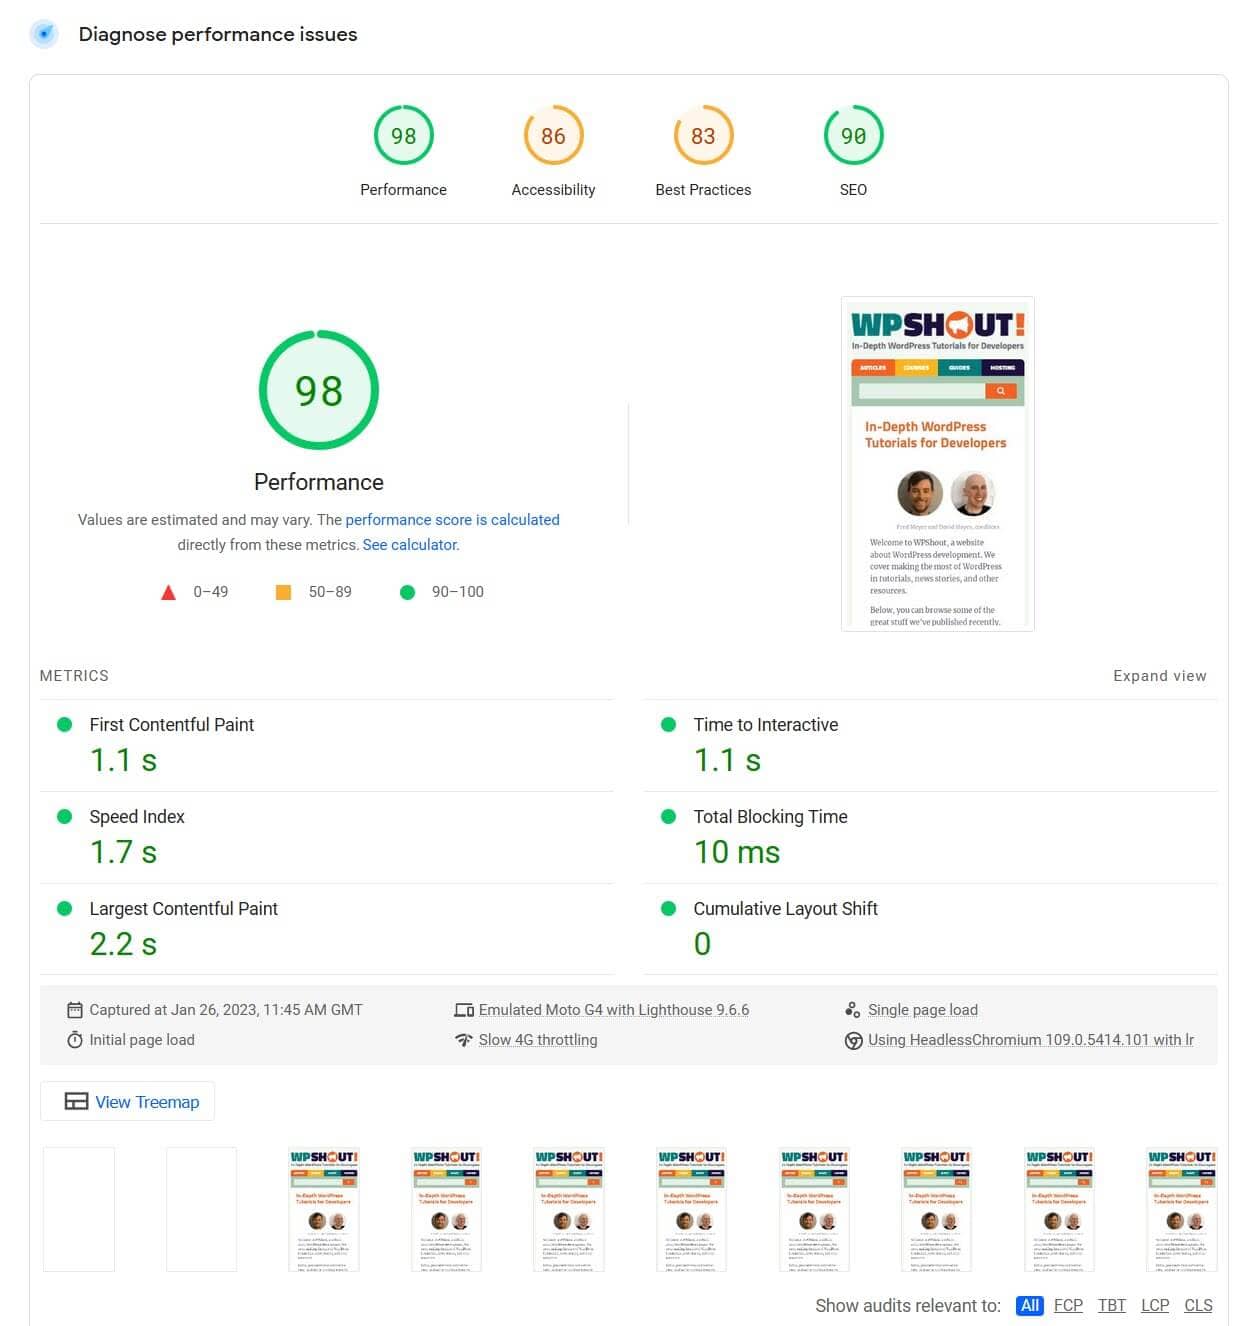
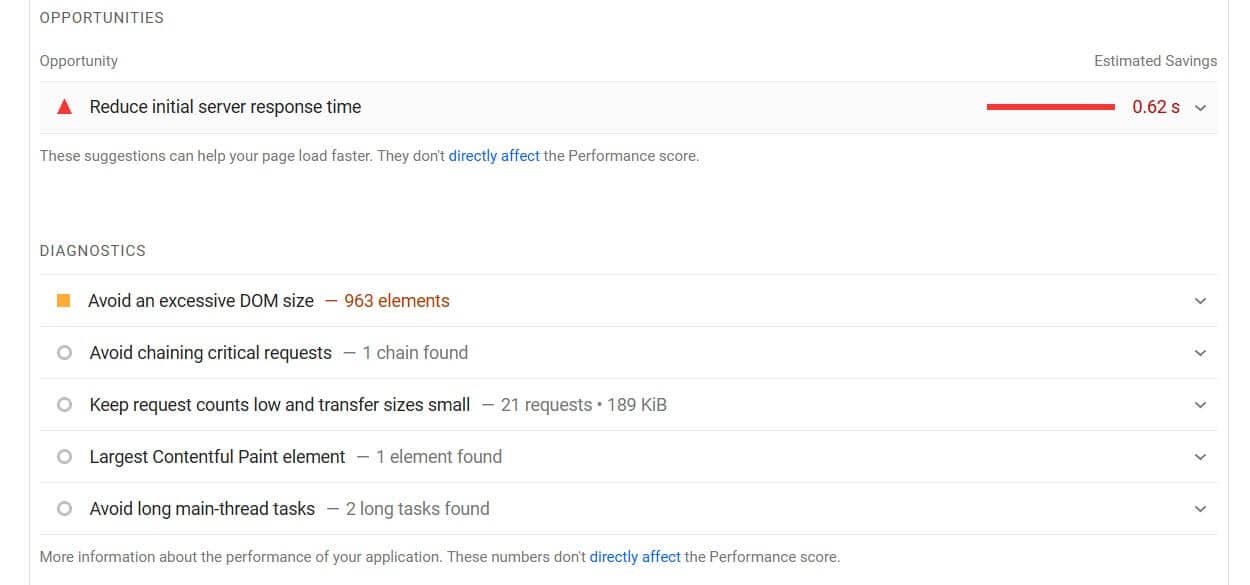
Below that are Google’s Opportunities and Diagnostics. These are ways you can indirectly improve your Performance score. The Performance metric has the most influence on your site speed.
Before we get into how to improve your website’s performance, let’s take a look at why website speed matters.
Why is website speed important?
Website speed has a huge impact on user and consumer behavior.
The average time it takes to fully load a mobile landing page is 22 seconds [1].
The probability of bounce increases 32% as page load time goes from 1 second to 3 seconds [2].
53% of visits are abandoned if a mobile site takes longer than 3 seconds to load [3].
Obviously, if you run an ecommerce site, a slow site results in decreased conversions, and that’s something you’ll want to address. Conversion rate drops with the time taken for a site to load [4]:
- Pages that loaded in 2.4 seconds had a 1.9% conversion rate
- At 3.3 seconds, conversion rate was 1.5%
- At 4.2 seconds, conversion rate was less than 1%
- At 5.7+ seconds, conversion rate was 0.6%
High PageSpeed Insights score vs actual page speed
Google calculates PageSpeed Insights score from both lab data (collected under controlled conditions) and field data (collected from real users in the wild).
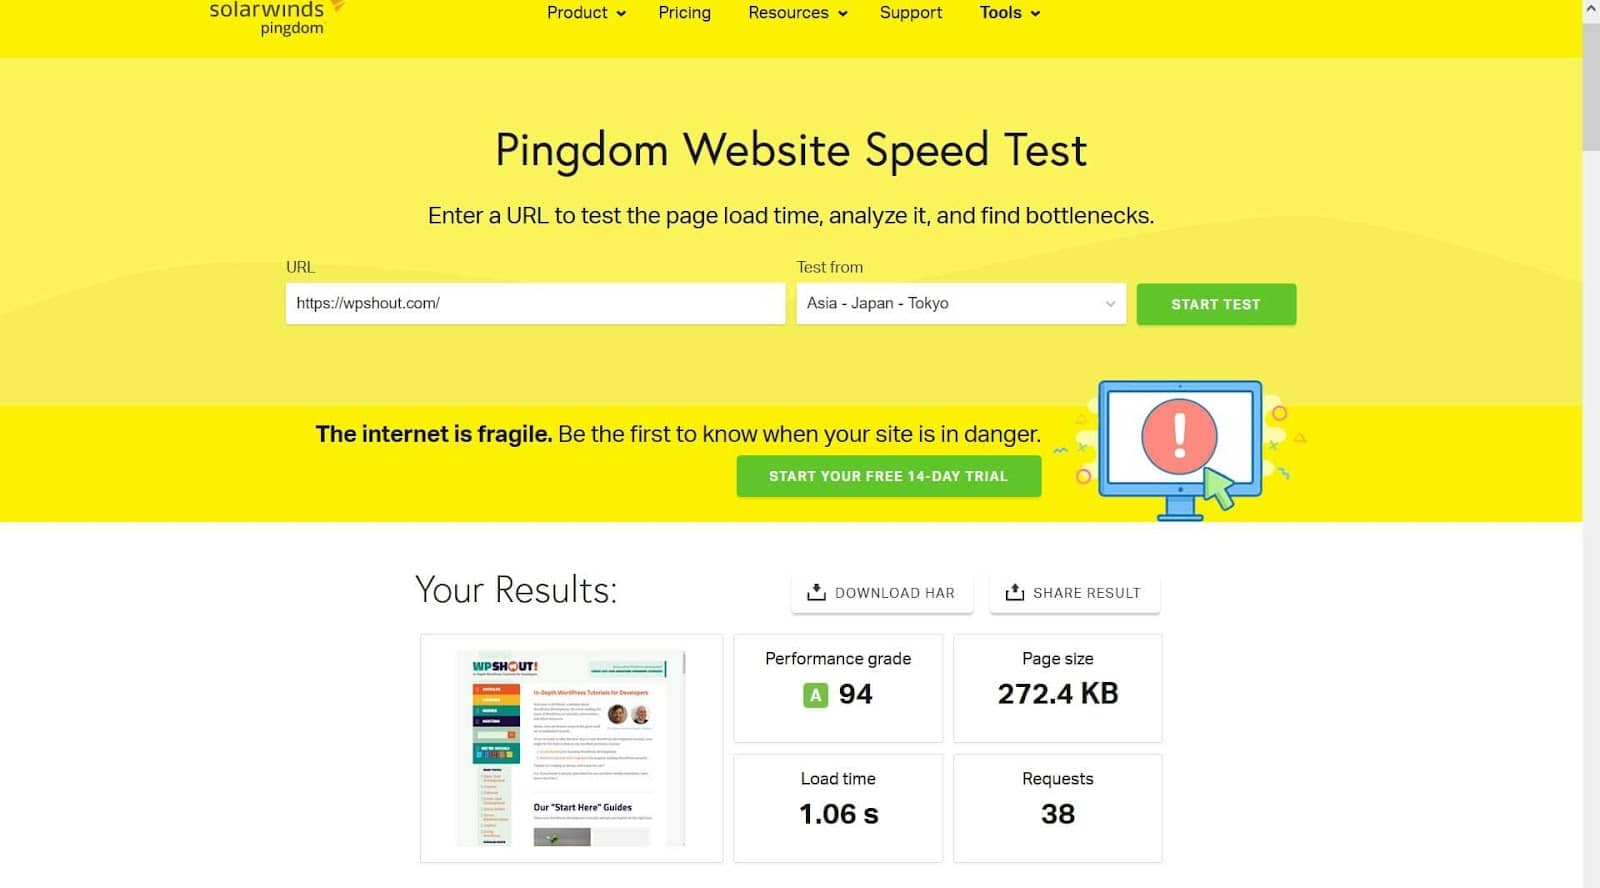
To test your actual page speed you can use online tools such as GTmetrix or Pingdom’s speed test.
Using these tools you can test your site across different locations.
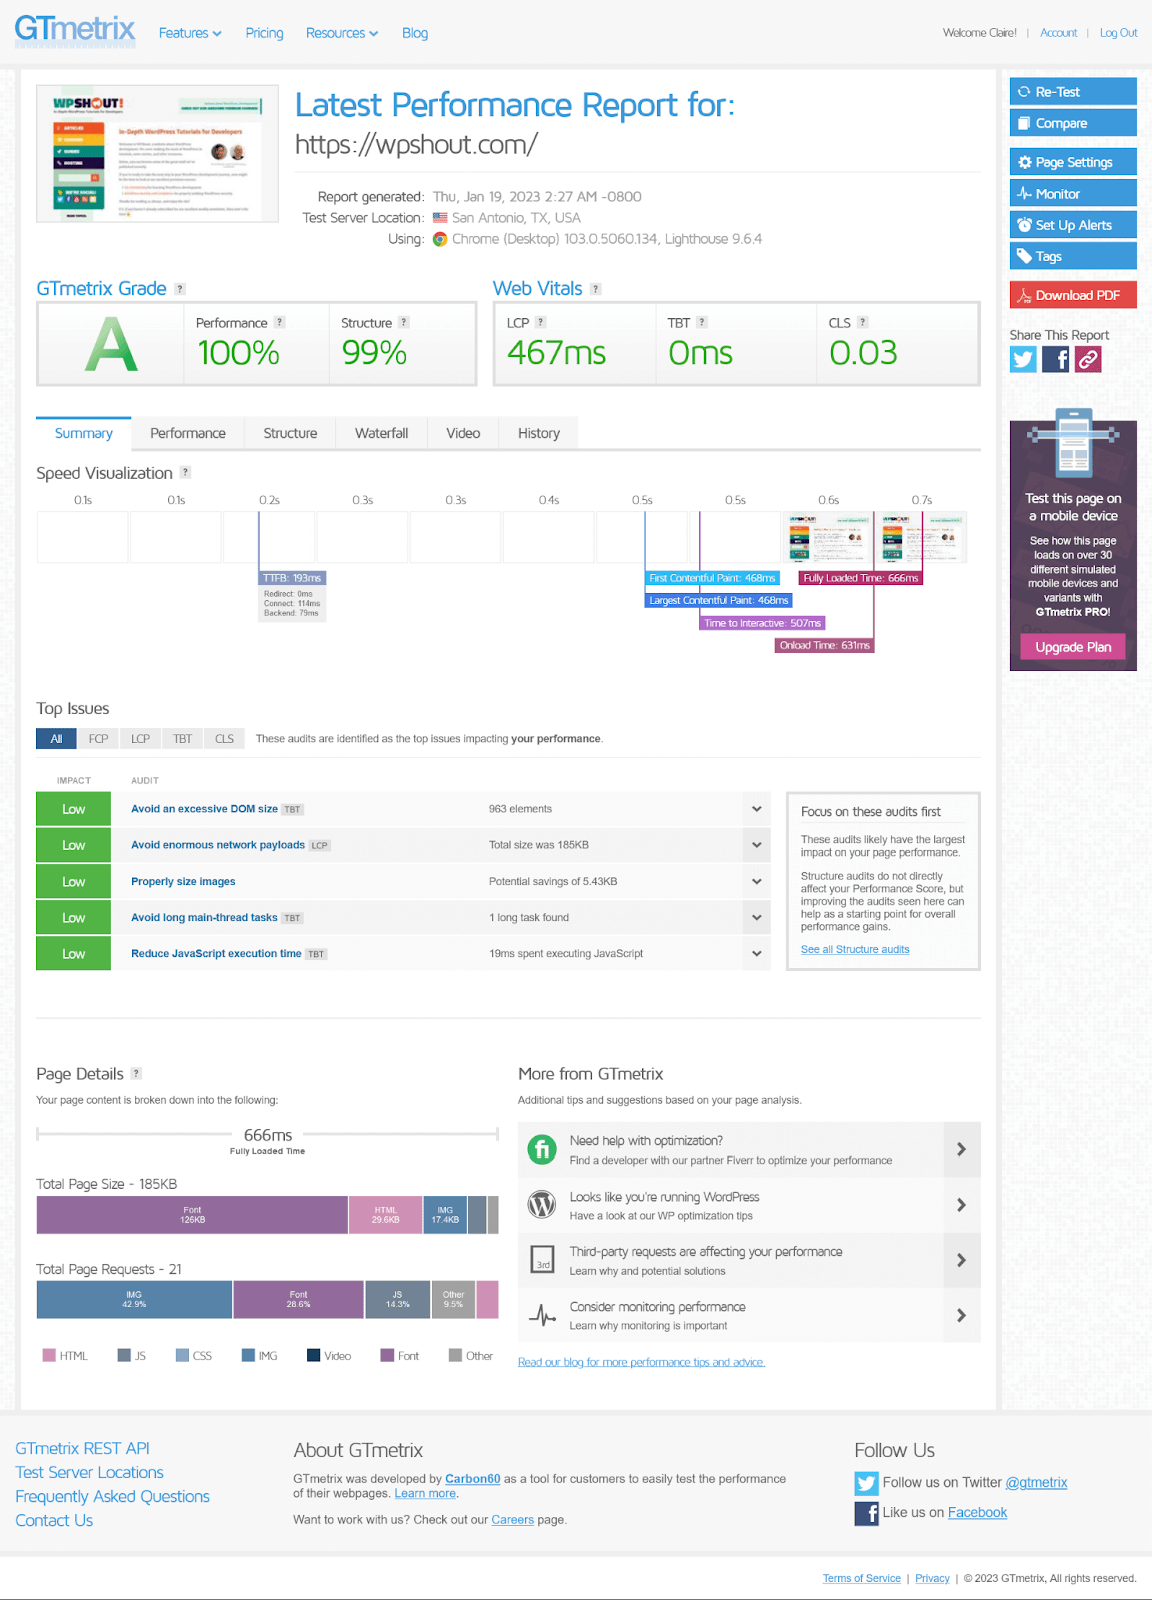
You can see on GTmetrix that the page load time for a test server in San Antonio, Texas is 666ms – a very good score.
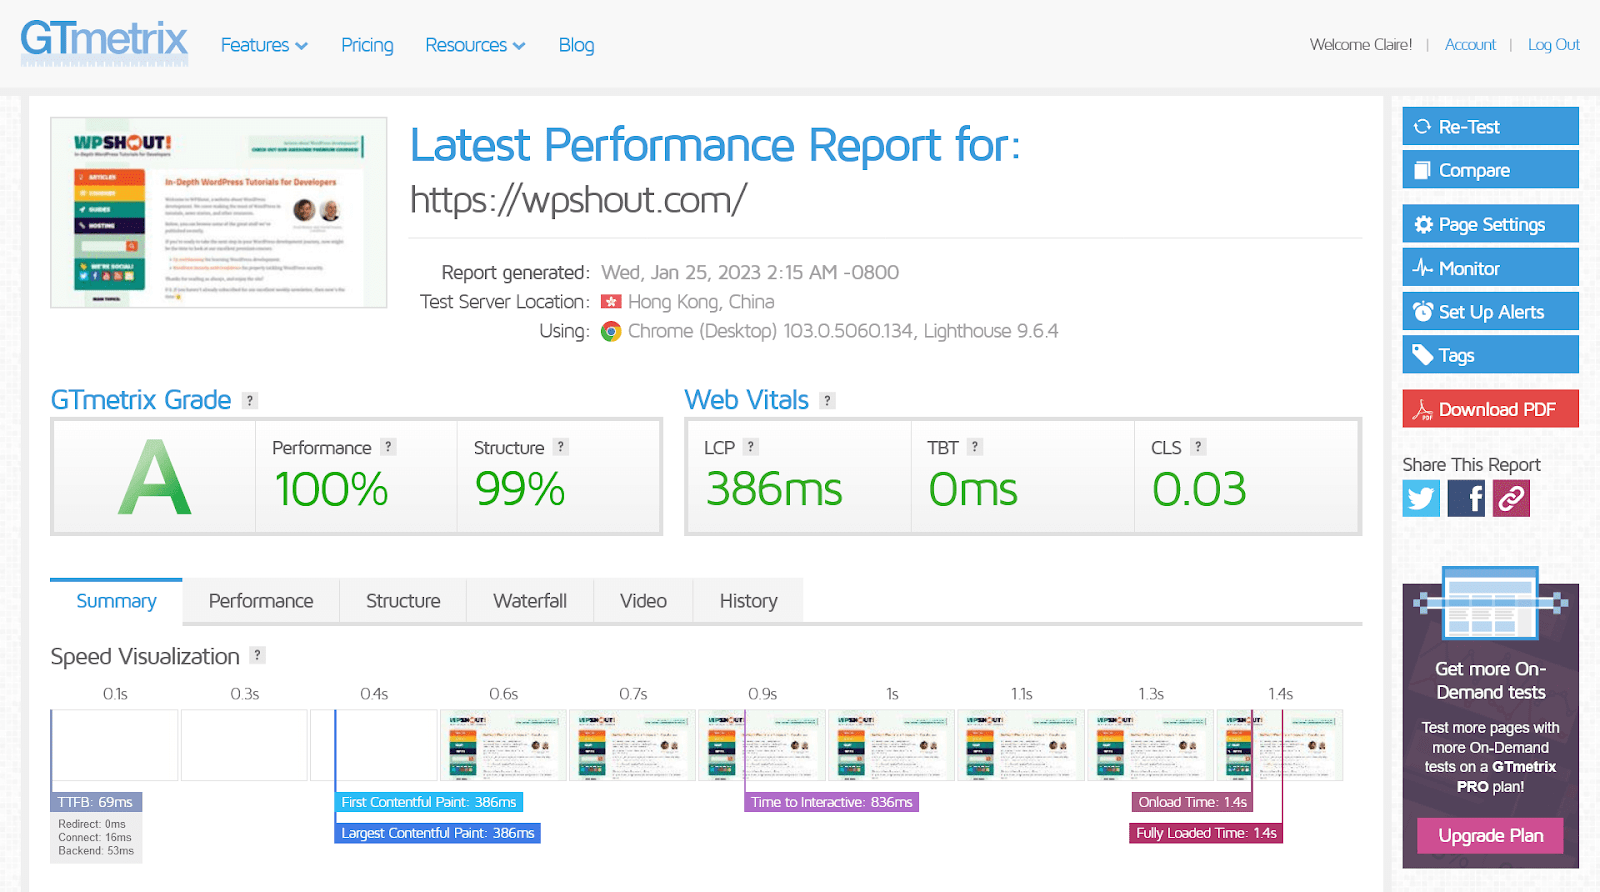
In Hong Kong, the page load time is a bit longer – 1.4s.
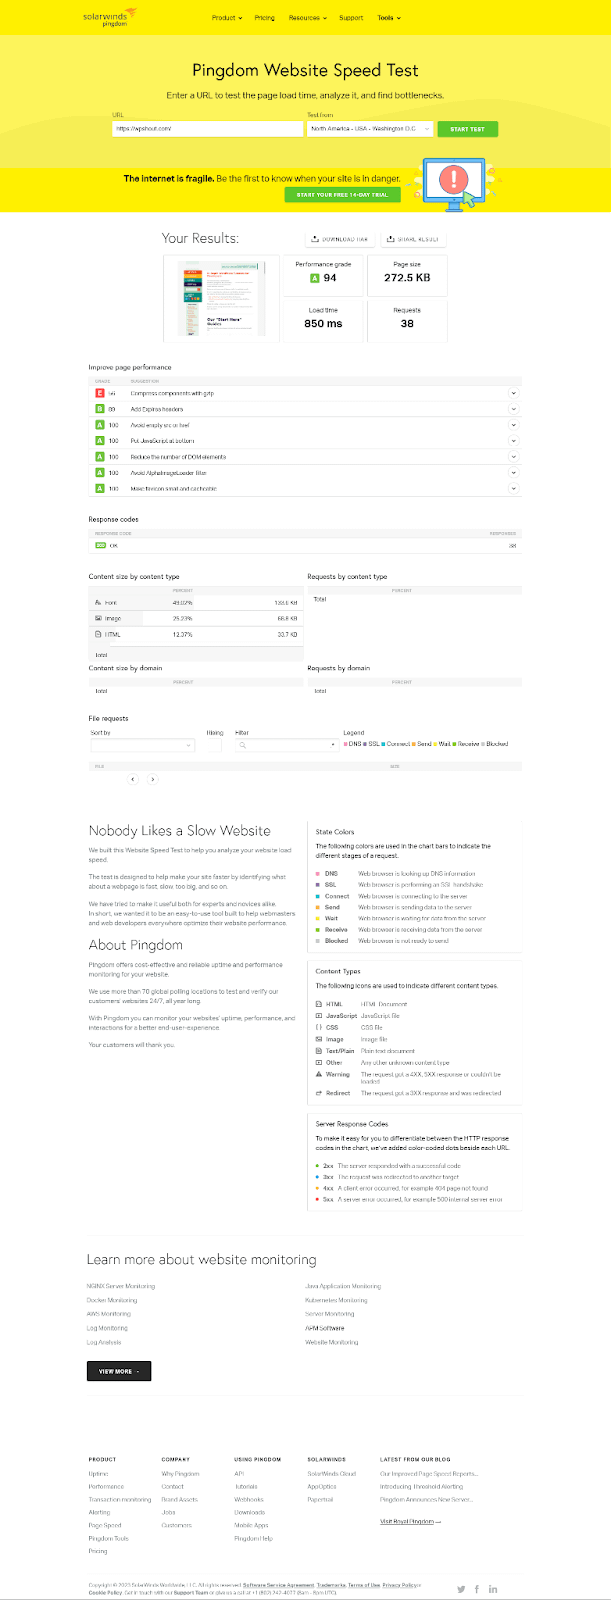
Pingdom also shows a fast load time of 850ms for a test in Washington D.C. but a slower load time of 1.06s in Tokyo, Japan.
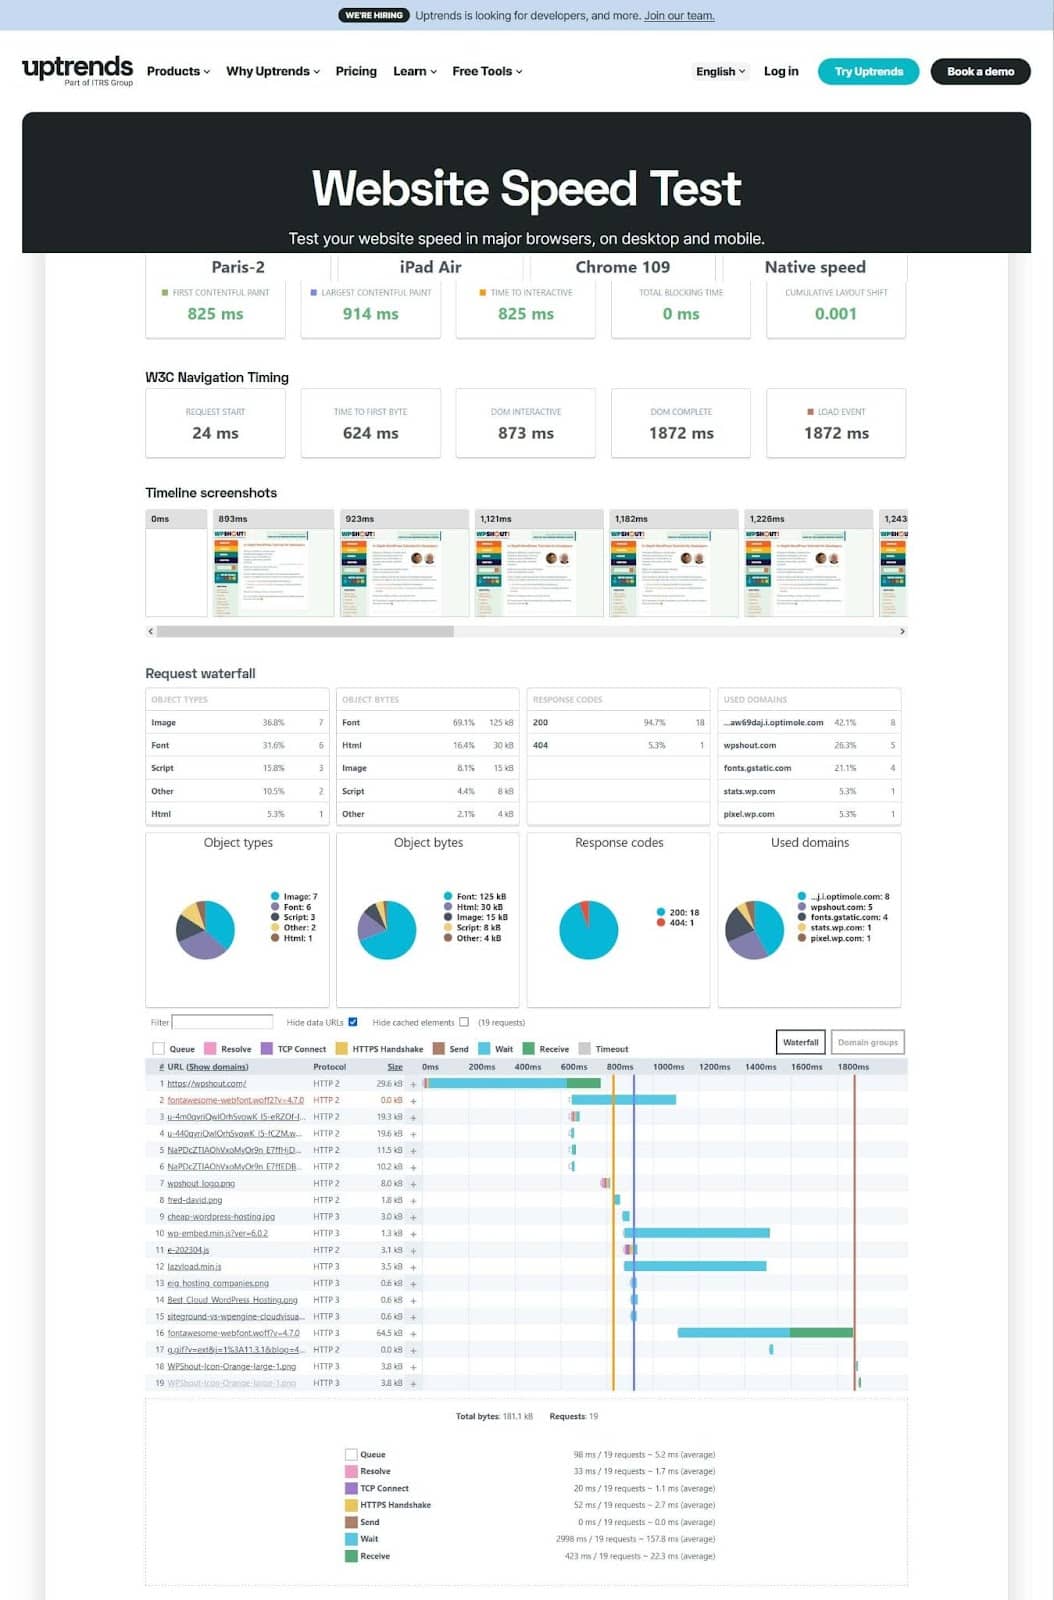
The Uptrends tool lets you test across mobile and desktop. Here’s the result for the WP Shout site from Paris, France on iPad Air – a load time of 1.9s:
So there seems to be a correlation between Google PageSpeed Insights score and the actual page speed.
How to get ideal Google PageSpeed Insights 100 score on WordPress
Now you know why a high Google PageSpeed Insights score is important, it’s time to look at ways you can improve it.
The ways to improve Google PageSpeed Insights score
1. Optimize images
Optimizing your images for the Web is an easy way to improve your Performance score.
You’ll need an image compression plugin such as Optimole.
This plugin can compress your images to a smaller file size so they are quicker to load. You can use them for all new image uploads as well as your existing ones. What’s great about Optimole is that it will also deliver your images through a CDN, making for an even quicker delivery.
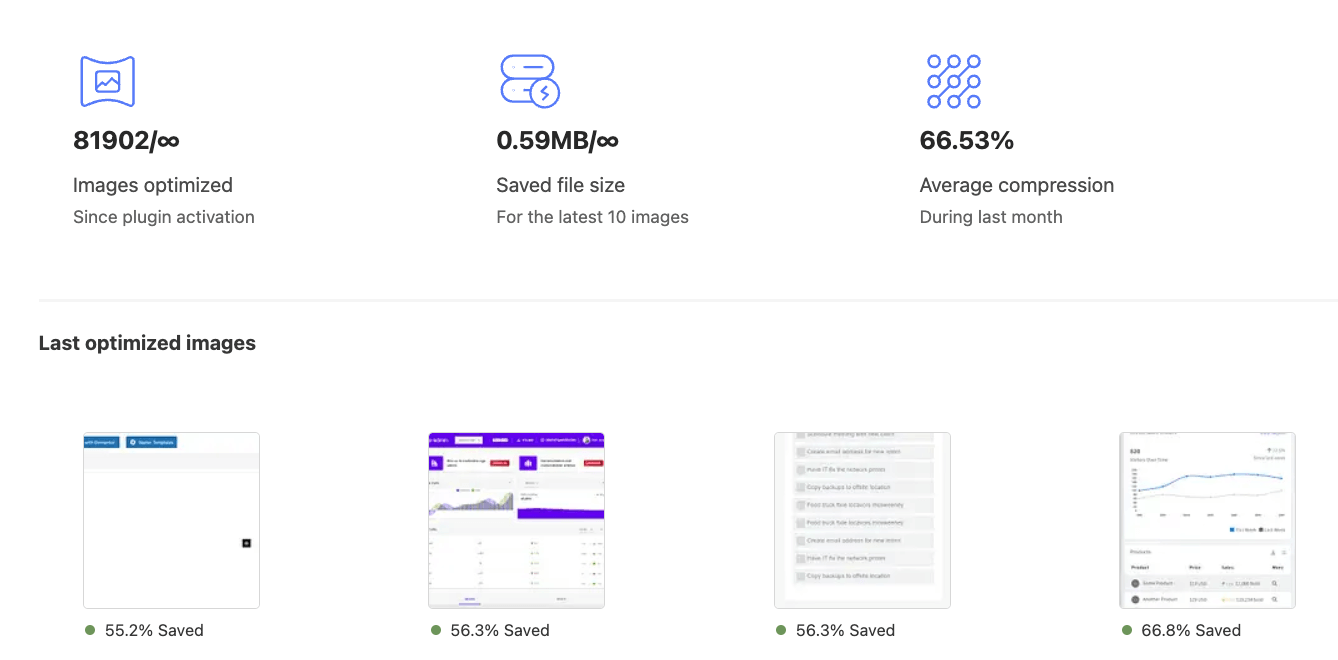
It can also convert your images to the WebP format, which has a smaller size than JPGs or PNG files. This will help you pass the Serve images in next-gen formats recommendation. In addition, you can resize any larger images you have by setting a maximum width for them.
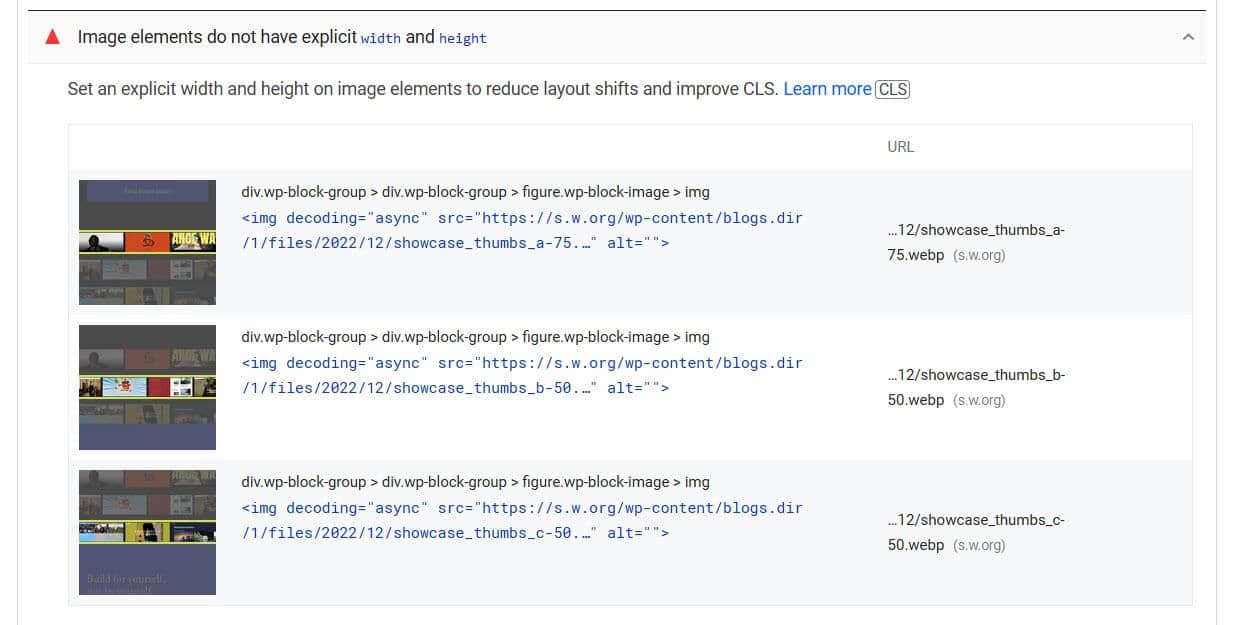
Make sure that your images have the width and height attributes specified to satisfy the Image elements do not have explicit width and height opportunity.
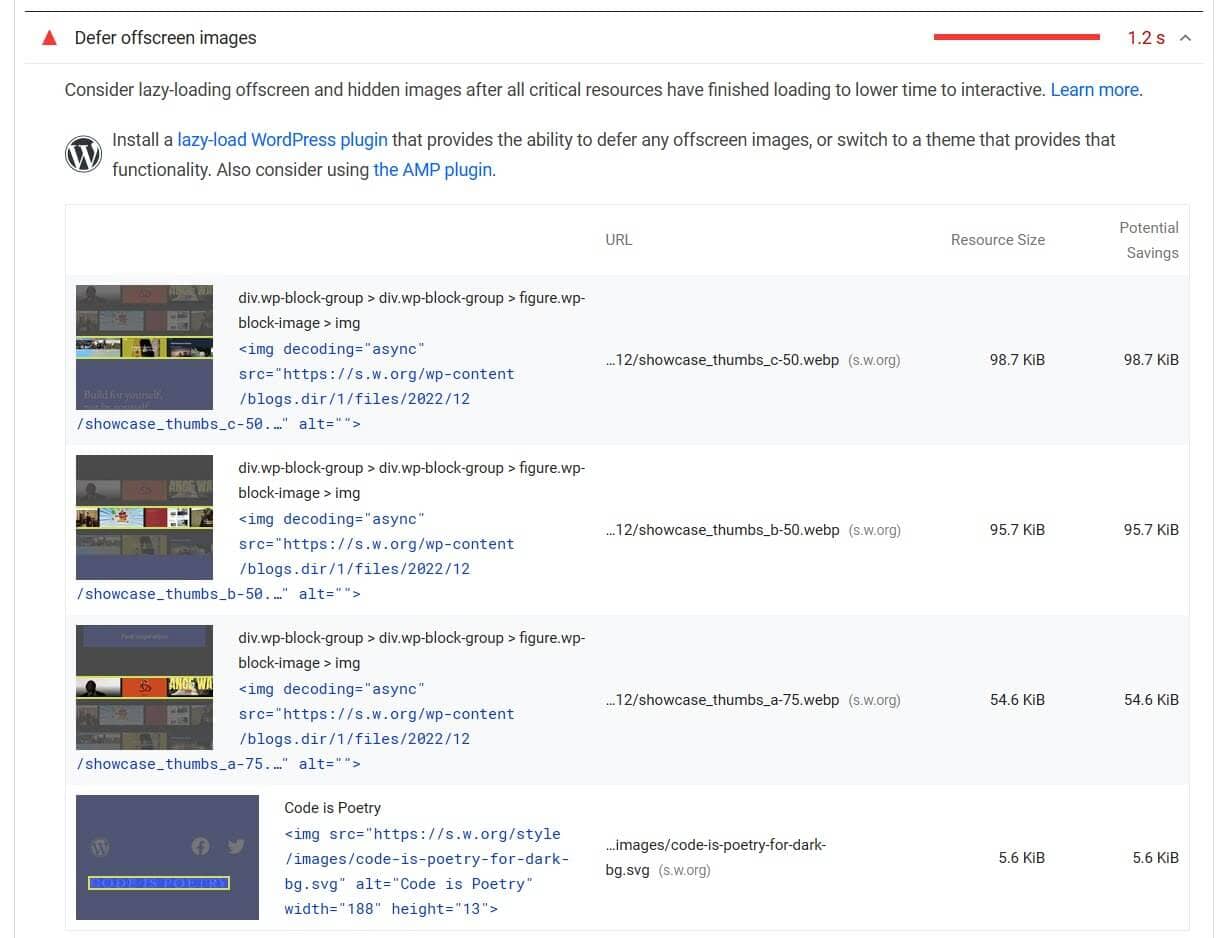
The Optimole plugin also includes lazy loading, which only loads images or videos when a user scrolls down to them. This helps with the Defer offscreen images opportunity, shown below.
Another method to reduce image file size is to use SVG images. SVGs are vector files so they can be easily rescaled without an impact on their file size. They are not natively supported in WordPress but you can add them to your Media Library with a plugin such as SVG Support or Safe SVG.
2. Avoid an excessive DOM size
What is the DOM? DOM stands for Document Object Model and is a tree-like structure with all the HTML elements, attributes and text of the page included.
A couple of strategies for decreasing the size of the DOM are to break up long web pages into smaller sections, and to avoid hiding DOM nodes with the {display:none;} declaration in CSS.
One factor that can increase DOM size is using a page builder. Page builders tend to increase the number of <div> elements on a page.
If you use Elementor, since version 3.0 some HTML wrappers have been removed, which has decreased the size of the DOM.
Or you could move to using Gutenberg instead of a page builder, as Chris Lema has done.
You can find more tips on avoiding an excessive DOM size in this post.
3. Optimize JavaScript and CSS
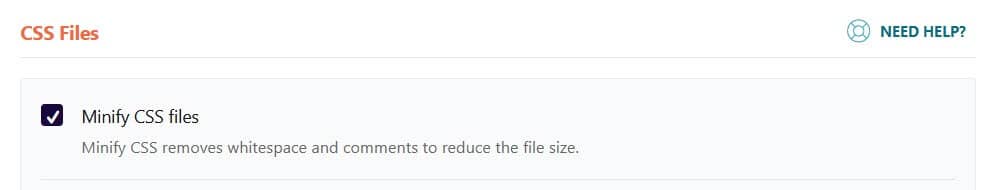
CSS and JS files can be minified and compressed to improve performance. Minification removes all the spaces from a CSS or JS file, while GZIP compression removes repeated characters such as {.
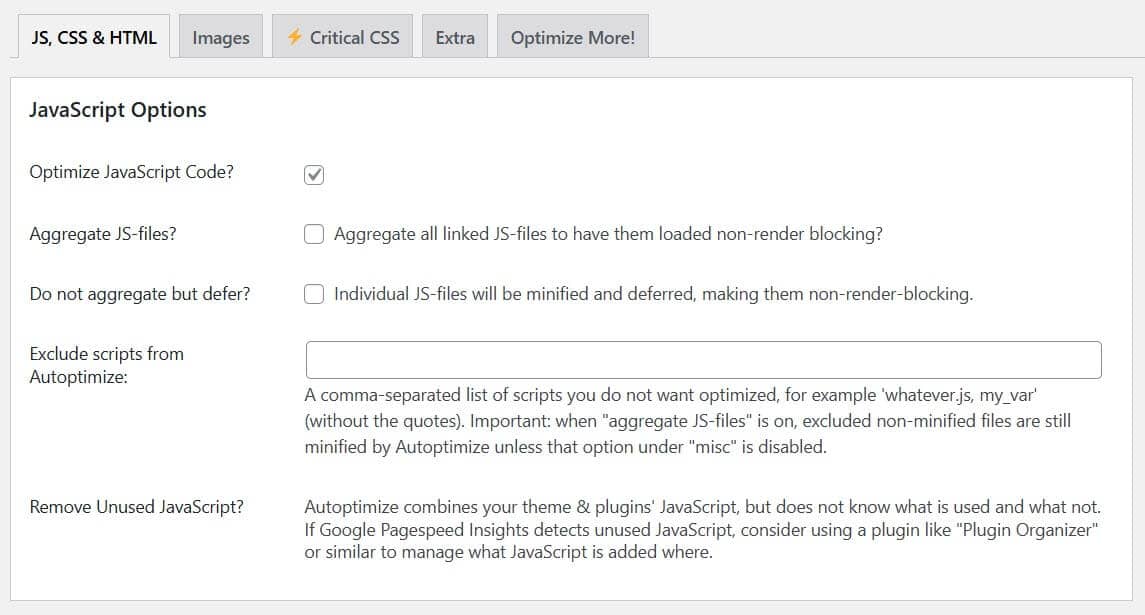
WordPress plugins which allow you to minify CSS or JS include Autoptimize (free) and WP Rocket (paid).
Minification can break your site, so plugins which minify have an exclude files from minification option if you have a problem.
WP Rocket also has the option to combine your CSS and JS files into a single file, reducing requests. You won’t want to do this if your web server uses HTTP/2, however. You can test if your server runs HTTP/2 to check first.
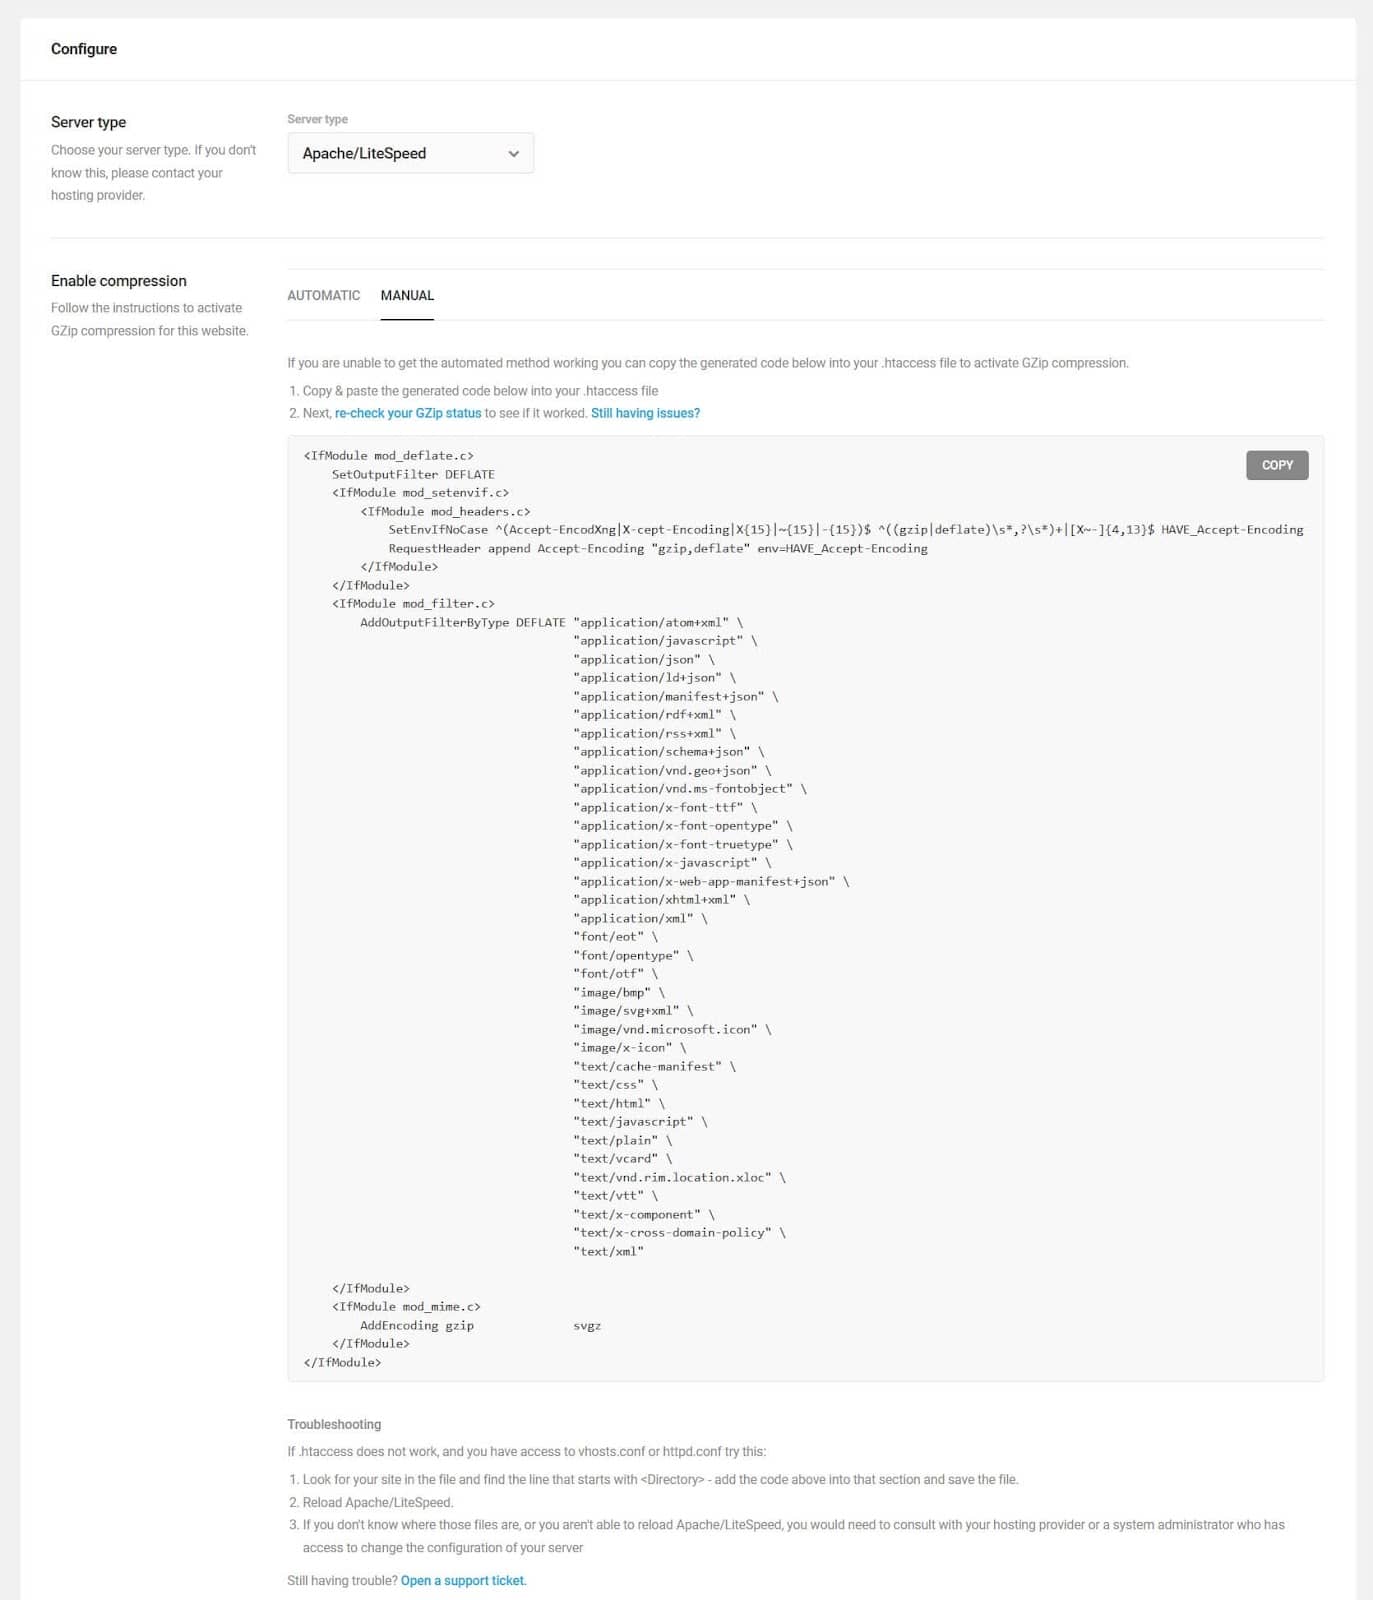
You can activate GZIP compression with most caching plugins. If your web server is Apache or LiteSpeed, the plugin can write to your .htaccess file directly or provide lines to copy and paste to it. If you use NGINX or IIS, Hummingbird also provides the configuration to enable compression on these servers.
If there’s any CSS or JS on your site that isn’t used, it’s time to remove it. You can use Chrome DevTools to find unused CSS and JS, which most likely comes from a plugin.
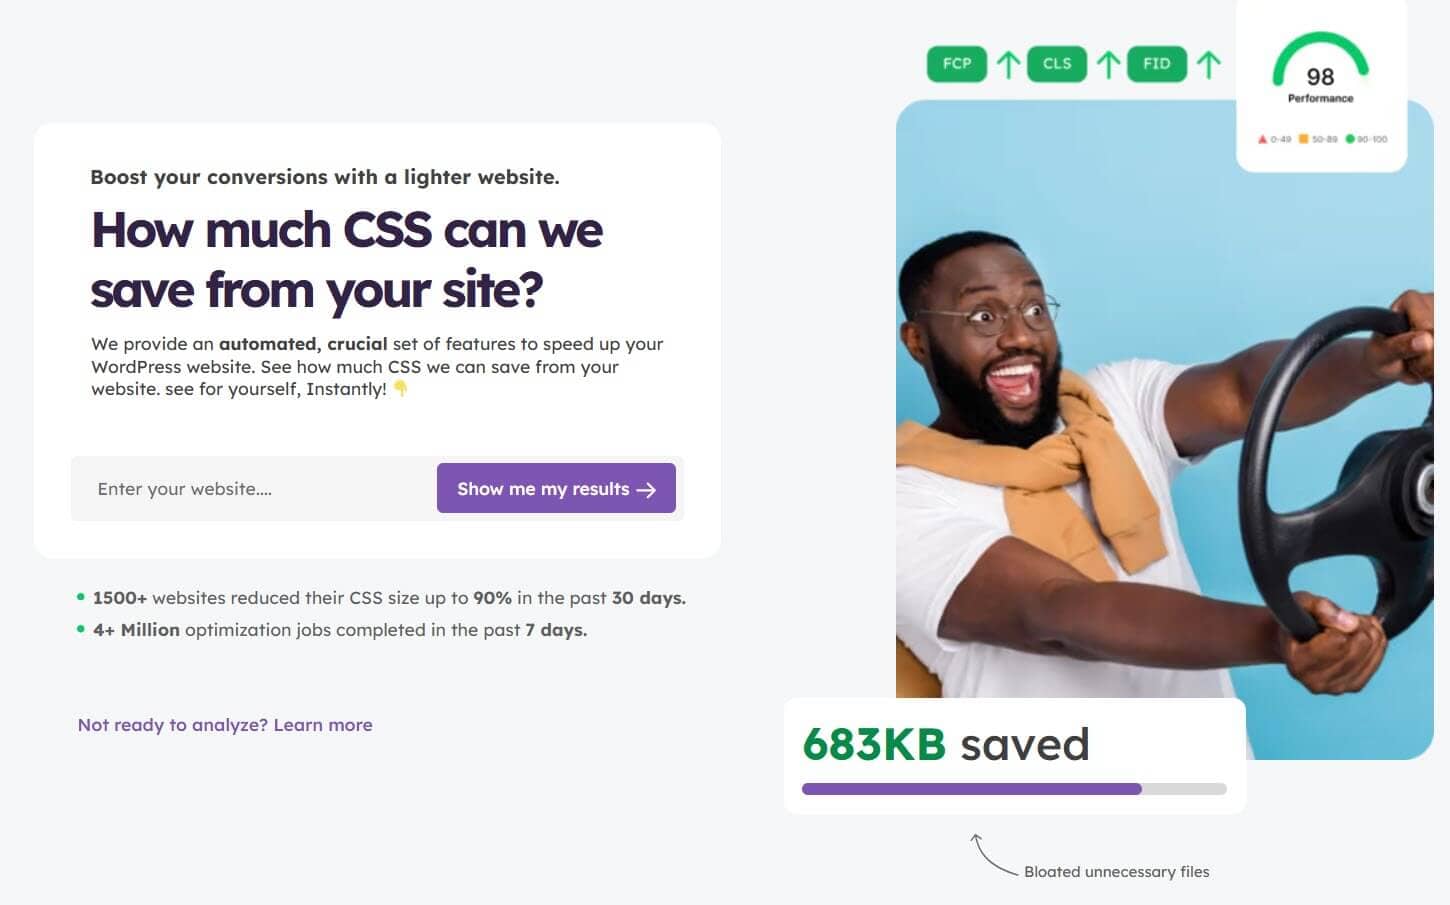
You can also use Rapidload’s CSS Saver to see what CSS you can lose from your website:
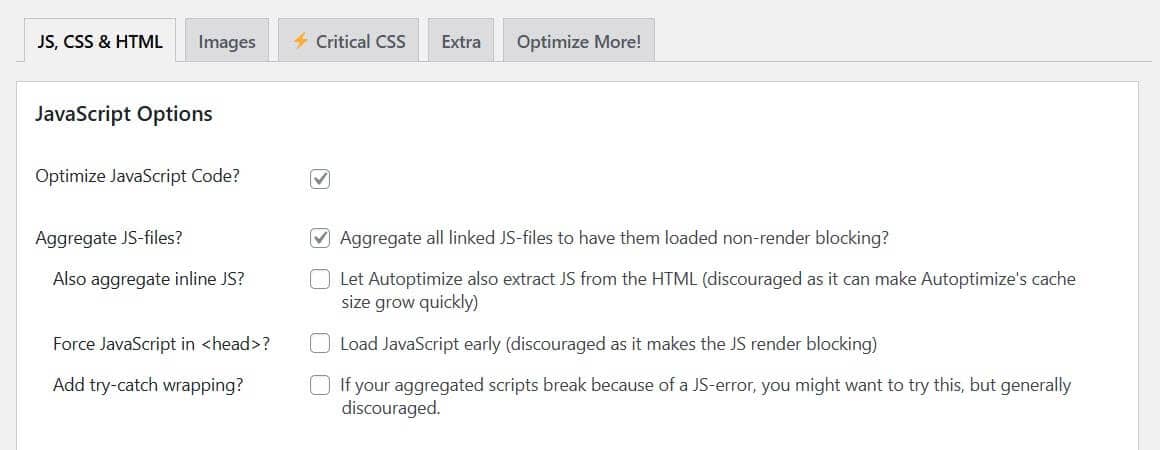
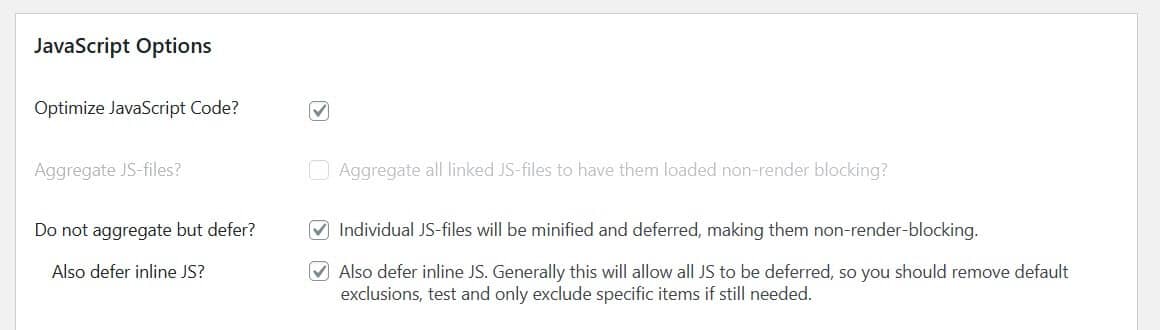
4. Eliminate render-blocking resources
Render-blocking CSS and JS are files which get flagged as blocking the first paint of your web page.
The Autoptimize plugin can remedy this problem, and as a result, improve your First Contentful Paint and Largest Contentful Paint scores.
5. Reduce initial server response time
Server response time depends on a few factors: the theme and plugins you use, and the type of web hosting you have.
Consider removing any excess plugins you don’t use or switching to a lightweight theme, such as Astra.
For hosting, we recommend managed WordPress hosting over shared web hosting. Managed WordPress hosts include server optimization as part of the service.
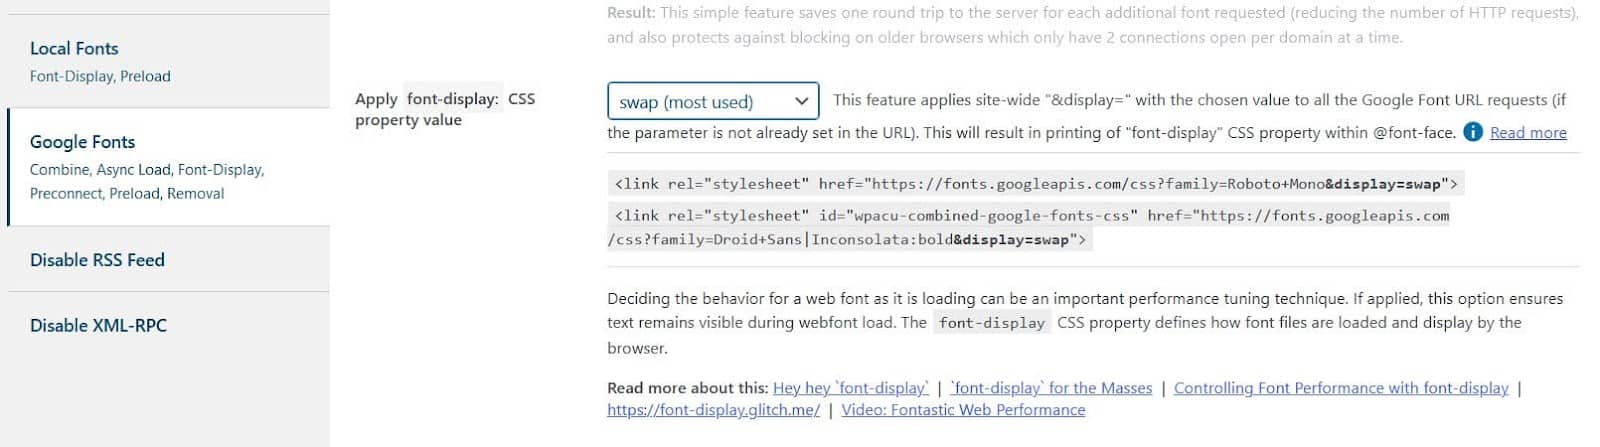
6. Ensure text remains visible during webfont loadEnsure text remains visible during webfont load
If you use web fonts, Google’s recommendation will stop the text of your pages being invisible while they load.
The recommendation suggests adding font-display: swap; to your @font-face declaration in your stylesheet.
The screenshot below shows how to add this property using the Asset CleanUp plugin.
7. Keep request counts low and transfer sizes small
Google PageSpeed Insights logs the number of files requested by the web server and the size of these files.
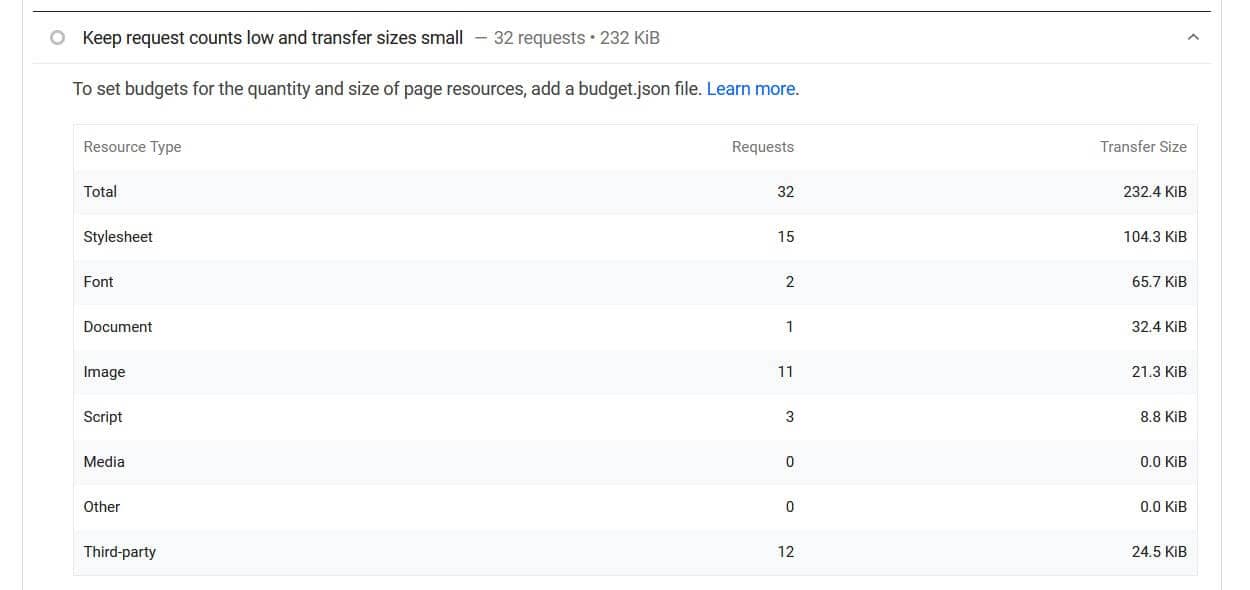
If you have large numbers here, you can reduce them by:
- Optimizing your images and media files. It’s recommended to use video files in place of animated GIFs.
- Optimizing your CSS and JS
- Optimizing your fonts and third-party scripts
- Reducing the size of the HTML file
8. Avoid chaining critical requests
Critical requests are requests that are essential to loading the page. For example, a logo could be a critical request.
Long chains and chains containing big downloads are considered bad for your website speed. They impact on the First Contentful Paint and Largest Contentful Paint.
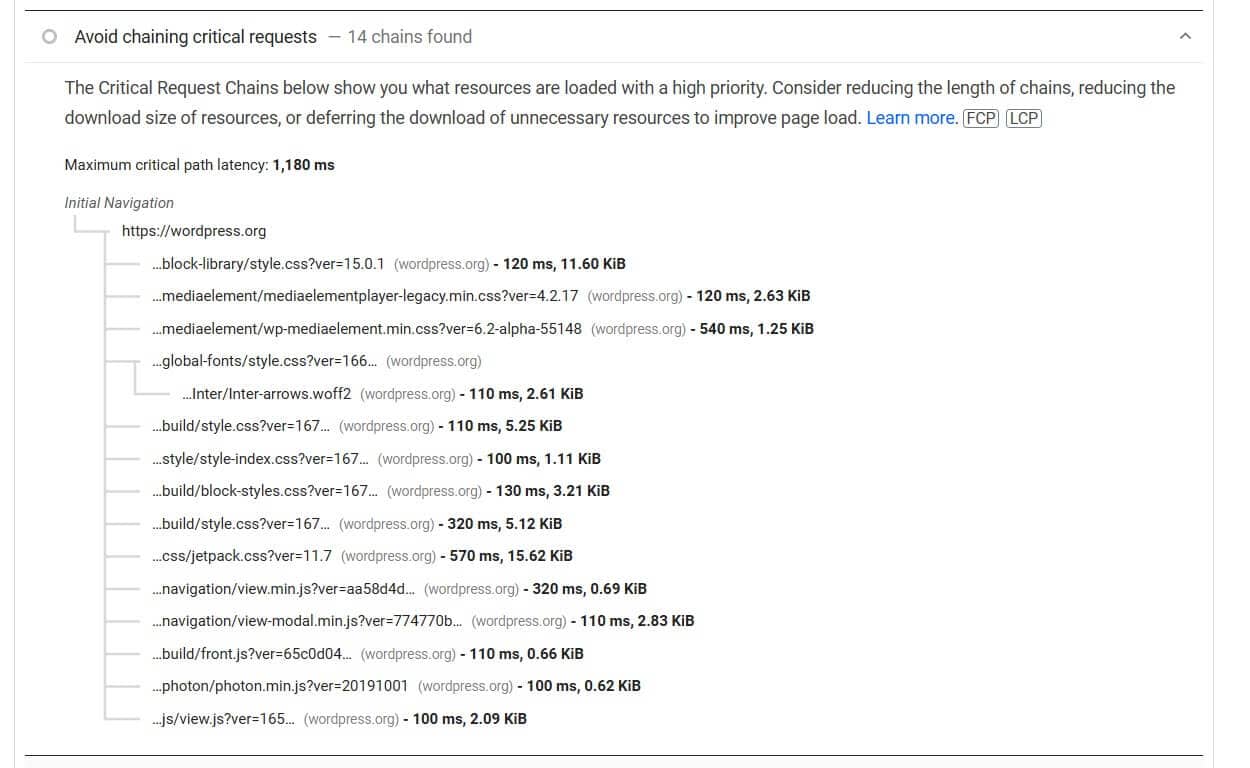
According to Google, to avoid chaining critical requests, you should:
- Minimize the number of critical resources: eliminate them, defer their download, mark them as async, and so on.
- Optimize the number of critical bytes to reduce the download time (number of round trips).
- Optimize the order in which the remaining critical resources are loaded: download all critical assets as early as possible to shorten the critical path length.
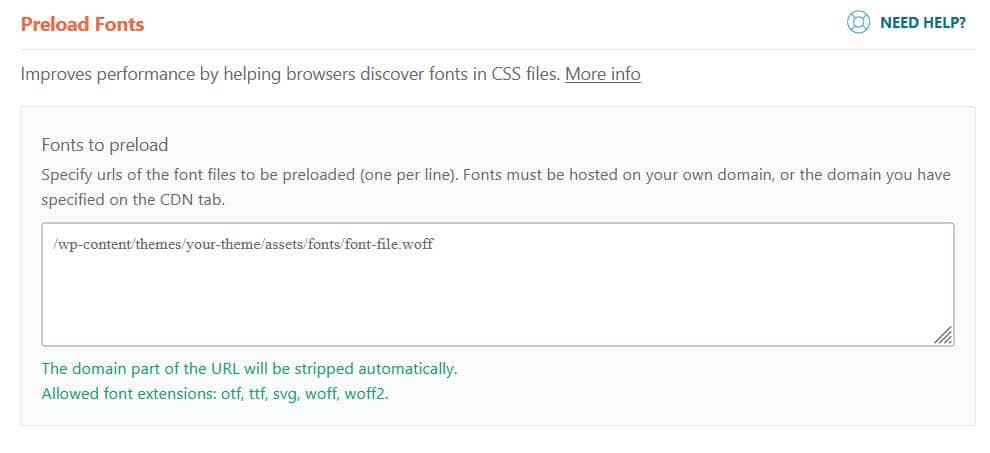
You can do this by:
- Preloading key requests, images and fonts by using “link rel=”preload” in the HTML that references them.
- Minifying your CSS and JavaScript.
- Eliminate render-blocking resources.
You can use a plugin like WP Rocket to perform these tasks for you.
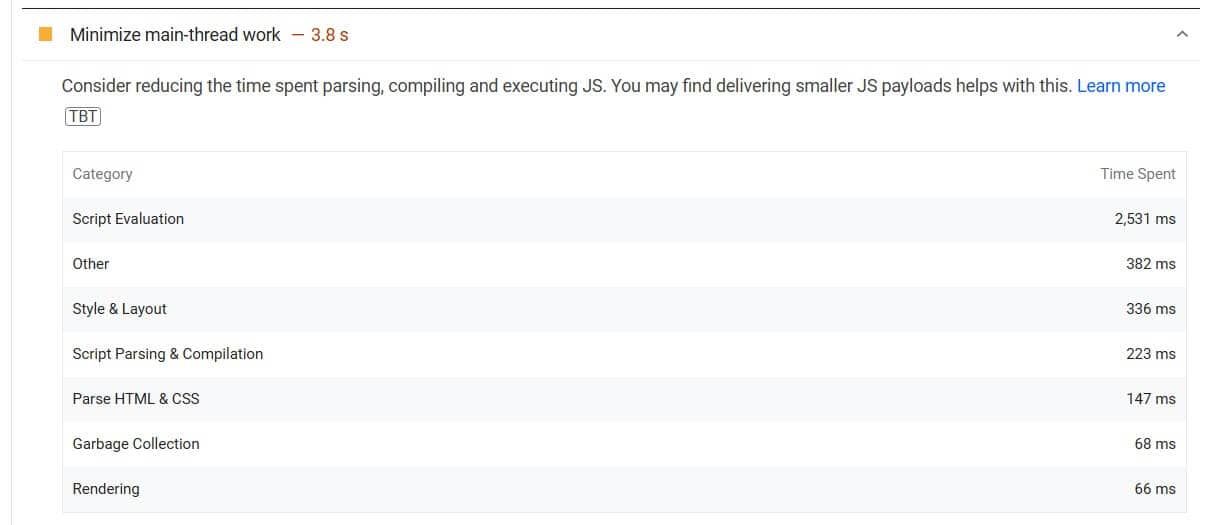
9. Avoid long main-thread tasks and minimize main thread work
Long main thread tasks are JavaScript tasks (over 50ms) that delay the Time to Interactive for the user.
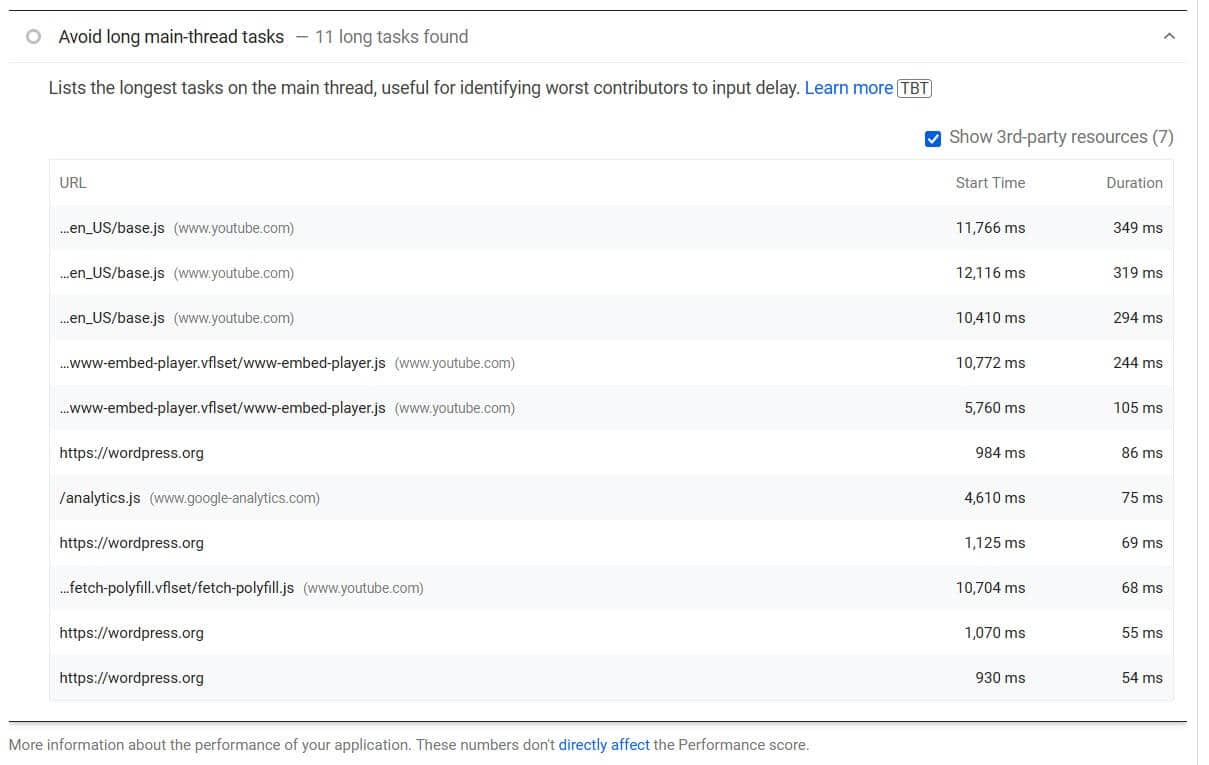
Minimizing main-thread work means decreasing the time on parsing, compiling and executing JS.
You can reduce the length and time of JavaScript tasks by:
- minimizing your use of bloated plugins
- hosting your fonts and analytics scripts locally
- minifying or deferring JS and CSS
- lazy loading background images
See the following article for more tips on minimizing main thread work in WordPress.
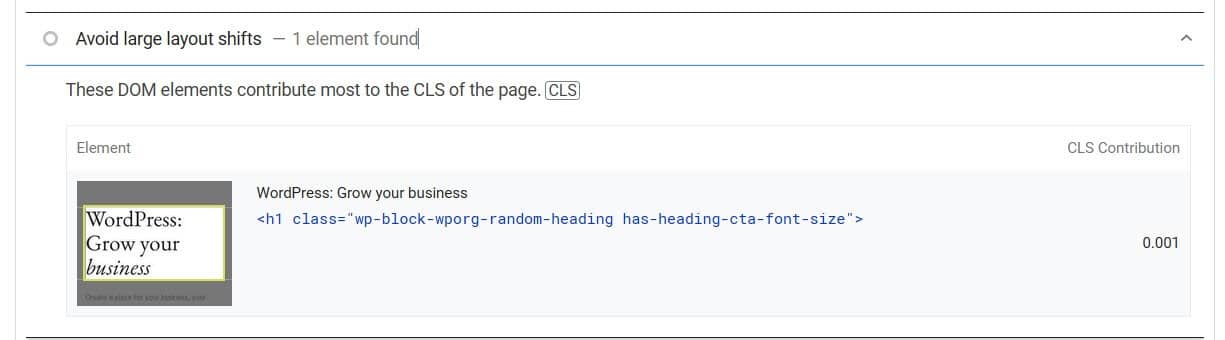
10. Avoid large layout shiftsAvoid large layout shifts
Layout shifts contribute to the Cumulative Layout Shift metric and give the impression to users of the page jumping.
You can cure this problem by:
- Adding dimensions to your media
- Preloading your fonts
- Optimizing your dynamic content e.g., newsletter signup forms
For more information, read this guide on fixing cumulative layout shift in WordPress.
11. Reduce the impact of third-party code
Third-party scripts are those hosted elsewhere, such as Google Analytics tracking or YouTube embeds.
Where possible, try to host scripts locally. You can’t do this with YouTube but you can host your analytics code and fonts locally.
You can use the Local Google Fonts plugin to host Google Fonts on your own server.
The Local Google Analytics for WordPress – caches external requests plugin will host your Google Analytics locally.
12. Use a CDN
A Content Delivery Network is a remote network of servers which store and serve web content to users.
A CDN can improve the speed of your site by caching static files (e.g., HTML, CSS and JavaScript) and serving them from a location nearby to a user. This helps reduce your First Contentful Paint and Largest Contentful Paint scores.
We use Cloudflare CDN at WP Shout. You can get started on it for free.
Learn more about why you should use a CDN and the best options.
Conclusion on how to get to Google PageSpeed Insights 100 score
We’ve seen that there are quite a few factors in play determining site speed. These tips will help you achieve a perfect score.
You shouldn’t get too hung up on scoring 100, though – a score of 90+ is still very good. Read David’s post on optimizing site performance to see what we did to improve our scores.
[1] https://www.thinkwithgoogle.com/intl/en-ca/marketing-strategies/app-and-mobile/mobile-page-speed-new-industry-benchmarks/
[2] https://www.thinkwithgoogle.com/marketing-strategies/app-and-mobile/page-load-time-statistics/
[3] https://www.thinkwithgoogle.com/consumer-insights/consumer-trends/mobile-site-load-time-statistics/
[4] https://www.cloudflare.com/en-gb/learning/performance/more/website-performance-conversion-rates/